在 Power BI 中过滤数据
介绍
在许多情况下,分析师需要将数据过滤到特定区域,例如销售额最高的区域或最昂贵的库存商品。这需要将数据过滤到考虑中的特定点。探索性数据分析用于描述性和诊断性分析,需要对数据进行许多过滤操作。您还需要过滤您准备的可视化仪表板。本指南将演示如何在 Power BI Desktop 中应用过滤器。
数据
在本指南中,您将使用多年来银行贷款发放的虚构数据集。该数据包含 3,000 个观测值和 17 个变量。您可以在此处下载数据集。本指南中要使用的变量如下所述:
Loan_disbursed:银行发放的贷款金额(以美元计)。
Weeknum:一年中的周数。
首先加载数据。
加载数据
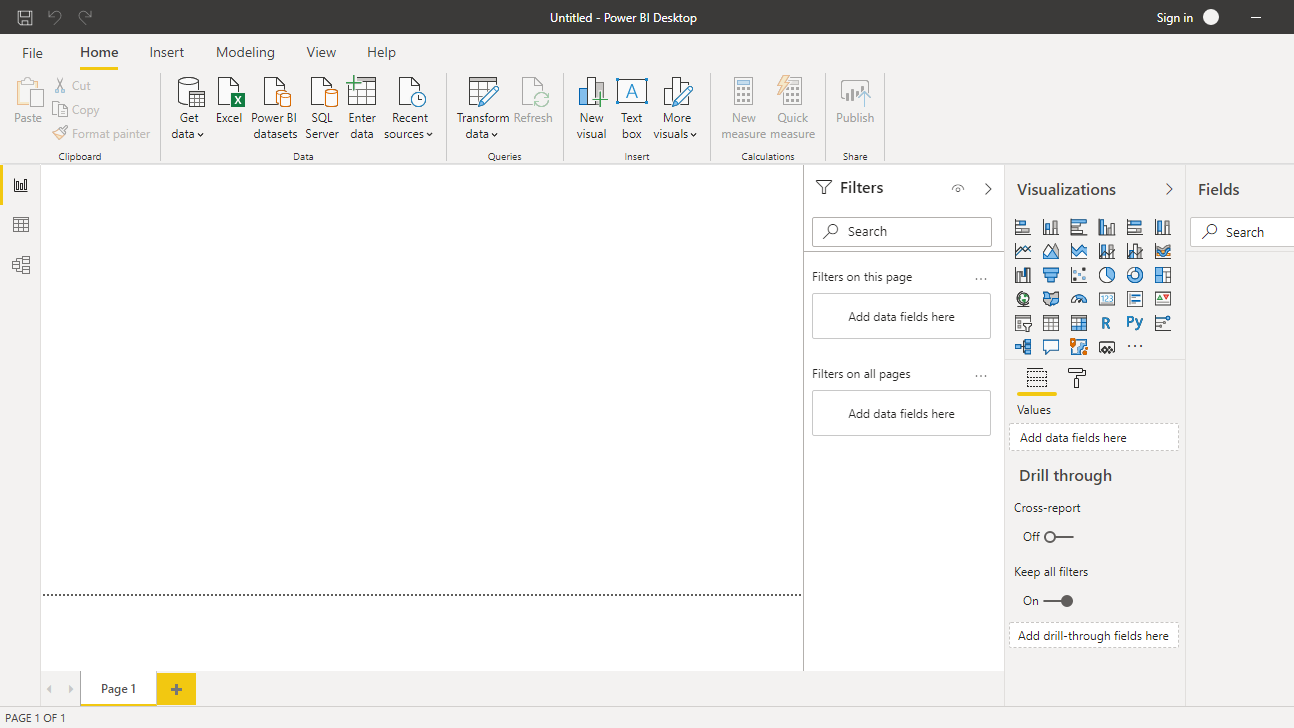
打开 Power BI Desktop 后,将显示以下输出。
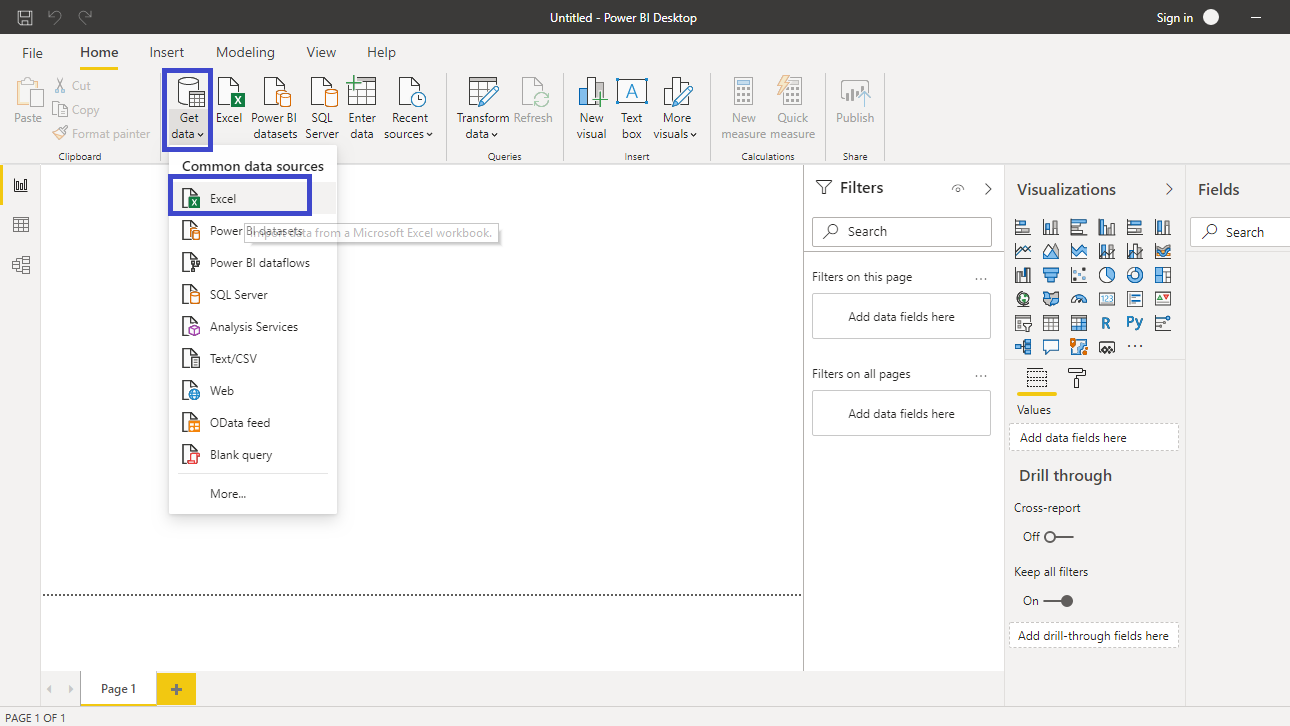
单击获取数据并从选项中选择Excel 。
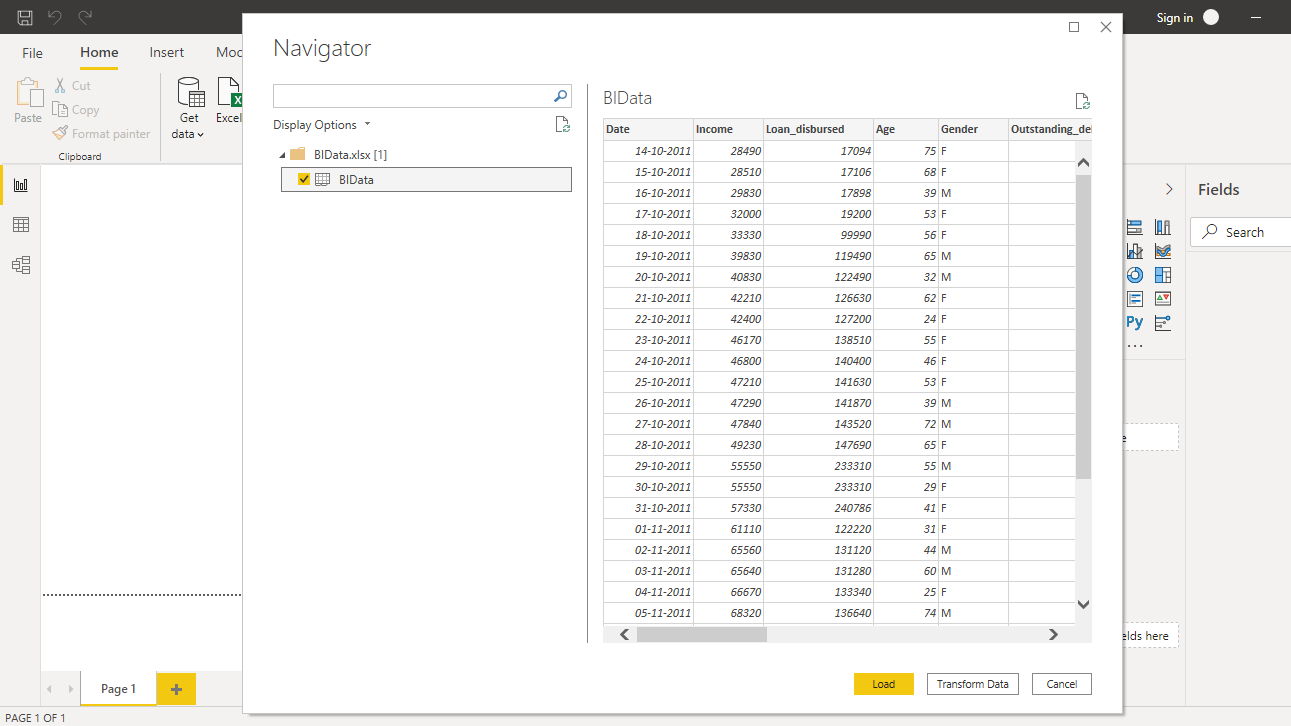
浏览到文件的位置并选择它。文件的名称是BIdata.xlsx,您将加载的工作表是BIData工作表。将显示数据预览,一旦您确信您正在加载正确的文件,请单击“加载”。
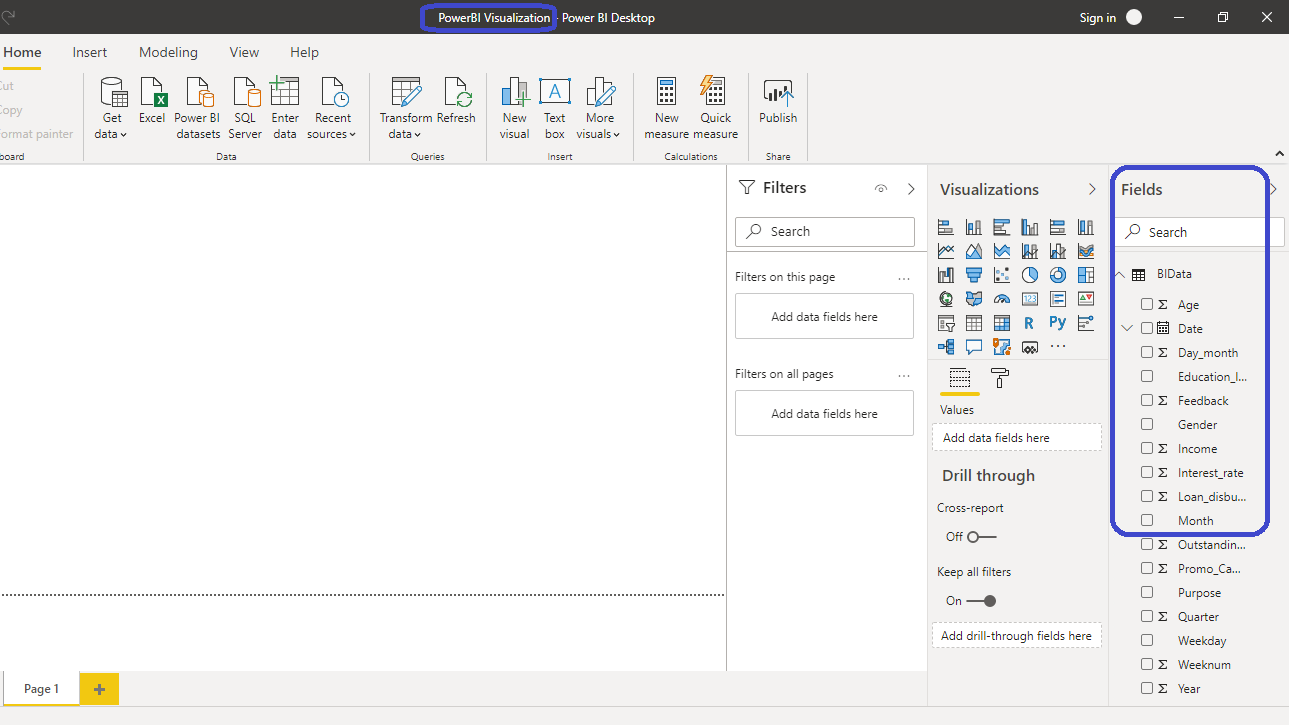
您已加载文件,可以保存仪表板。它被命名为PowerBI Visualization。“字段”窗格包含数据的变量。
添加图表
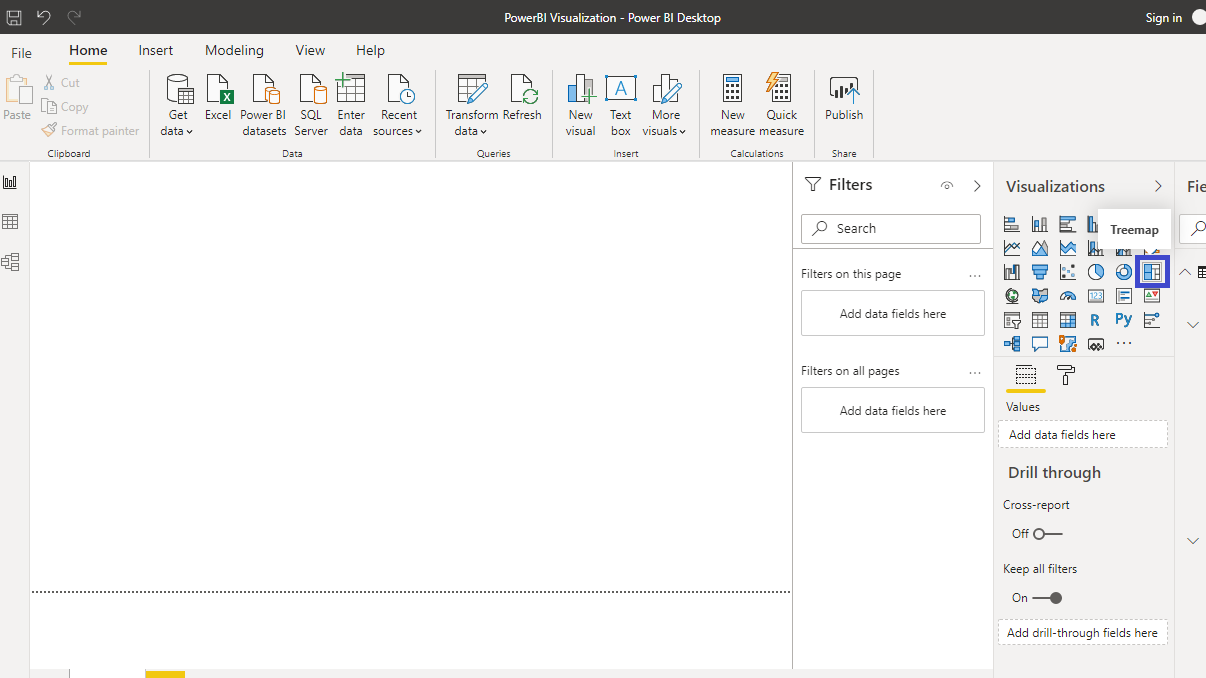
要在 Power BI 中执行过滤操作,您需要一个图表、表格或矩阵。您将在本指南中创建一个树形图。您可以在“可视化”窗格中找到它。
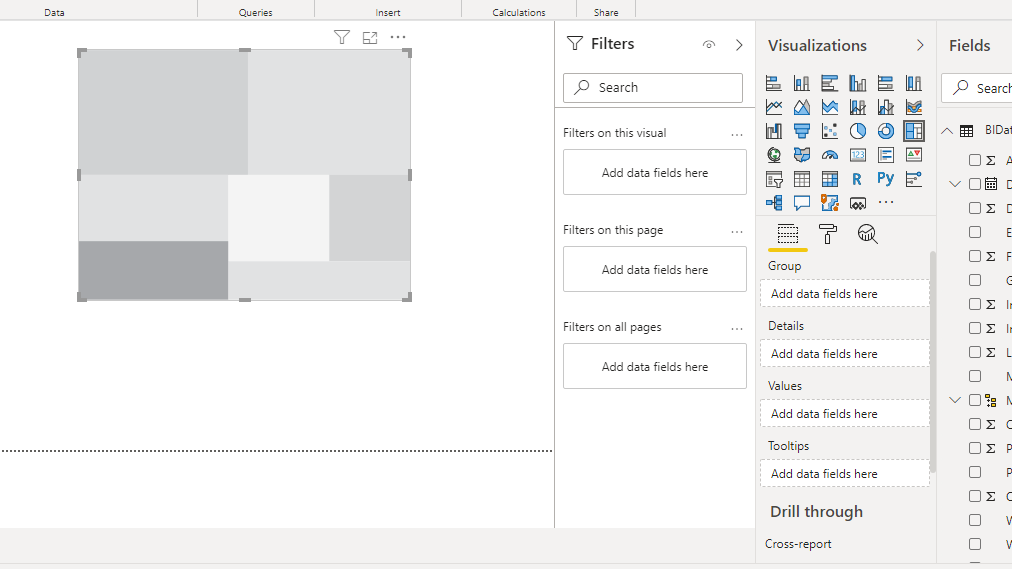
单击上面显示的图表,它将在画布中创建一个图表框。由于您尚未添加所需的可视化参数,因此不会显示任何内容。
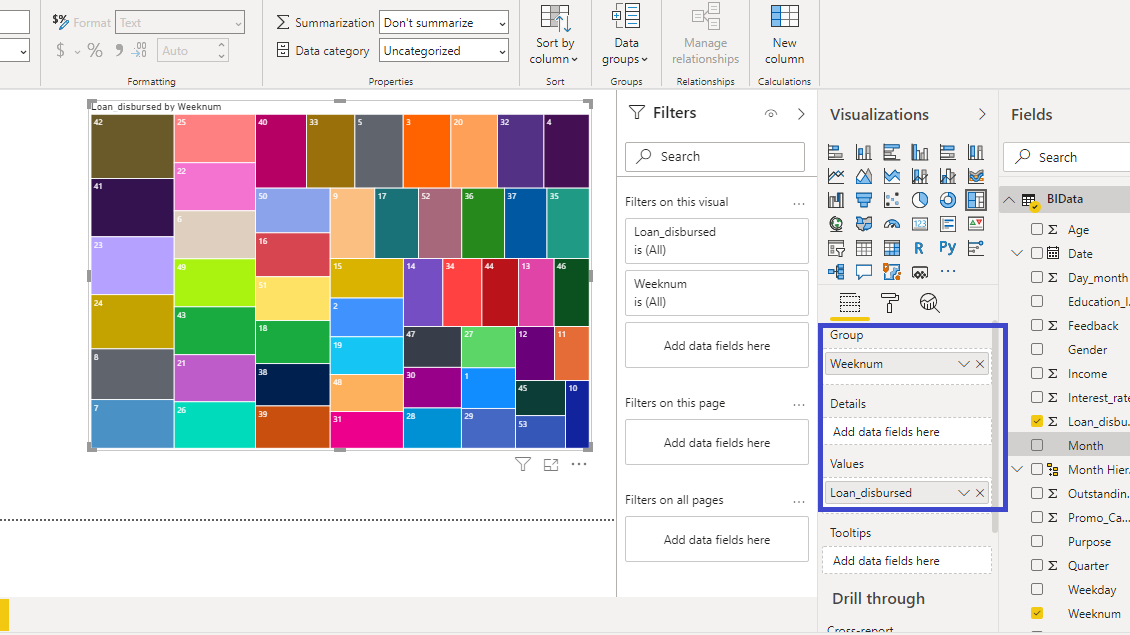
您可以在画布上调整图表的大小。下一步是在Fields选项下填充可视化参数,如下所示。要使用的两个变量是Weeknum和Loan_disbursed。将变量Weeknum拖到Group字段中,将Loan_disbursed拖到Values字段中。
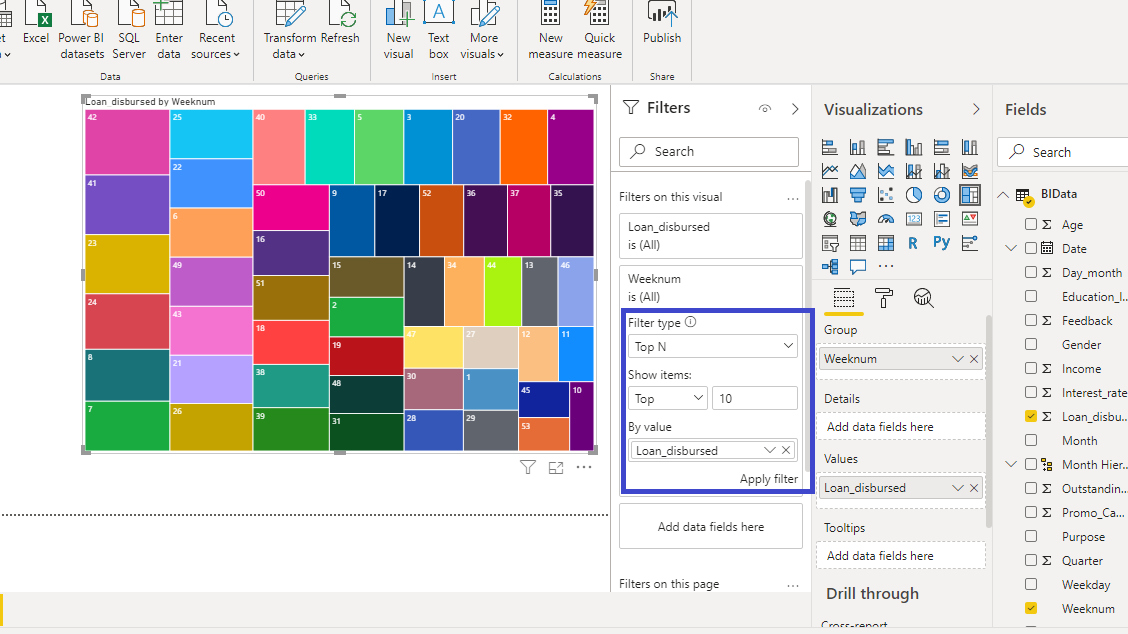
上面的输出显示树形图视觉效果已创建,下一步是探索过滤选项。
过滤操作
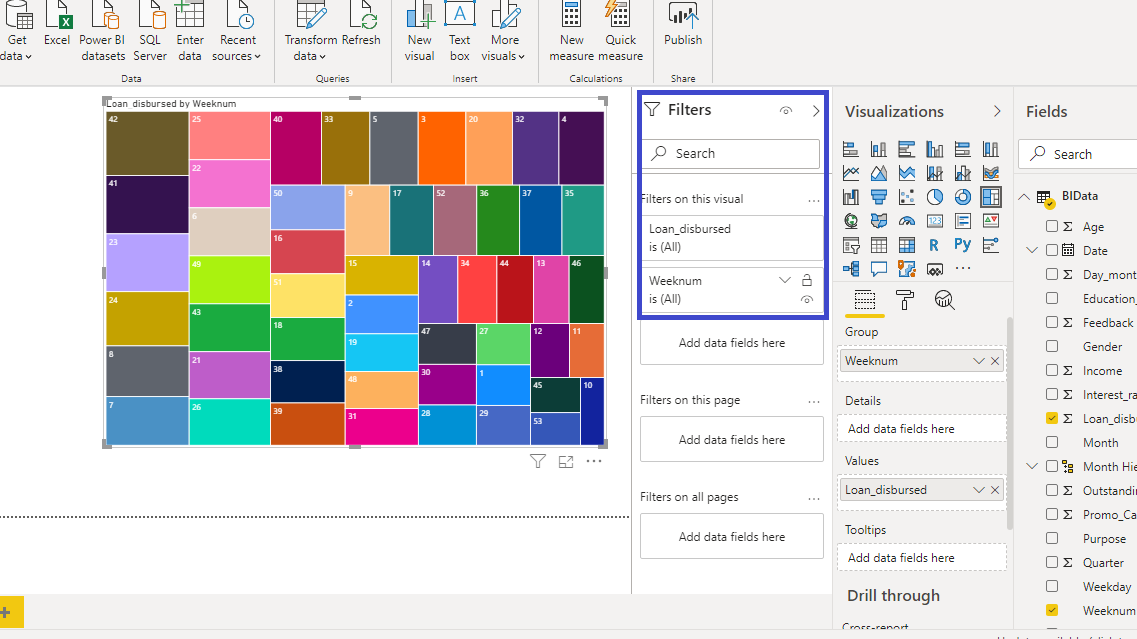
The filter operations are performed with the Filters pane. Once the visual is created, the Filters pane automatically displays the variables under Filters on this visual option.
Filter on Numerical Variable
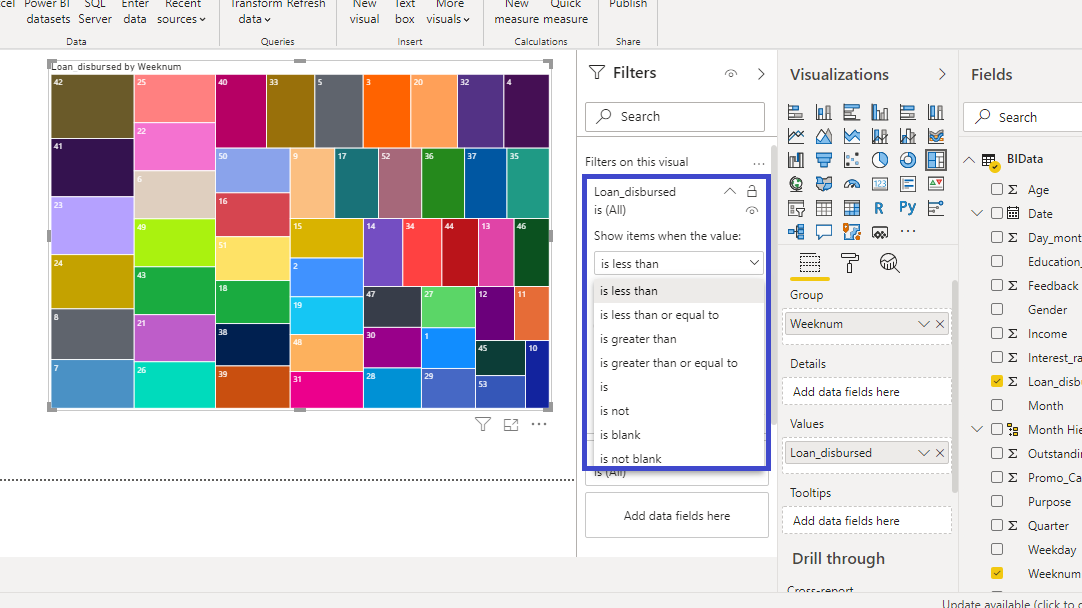
Numerical and qualitative variables require different filter operations. To begin, click on the Loan_disbursed variable under Filters on this visual. Next, you will see many options to filter under Show items when the value option.
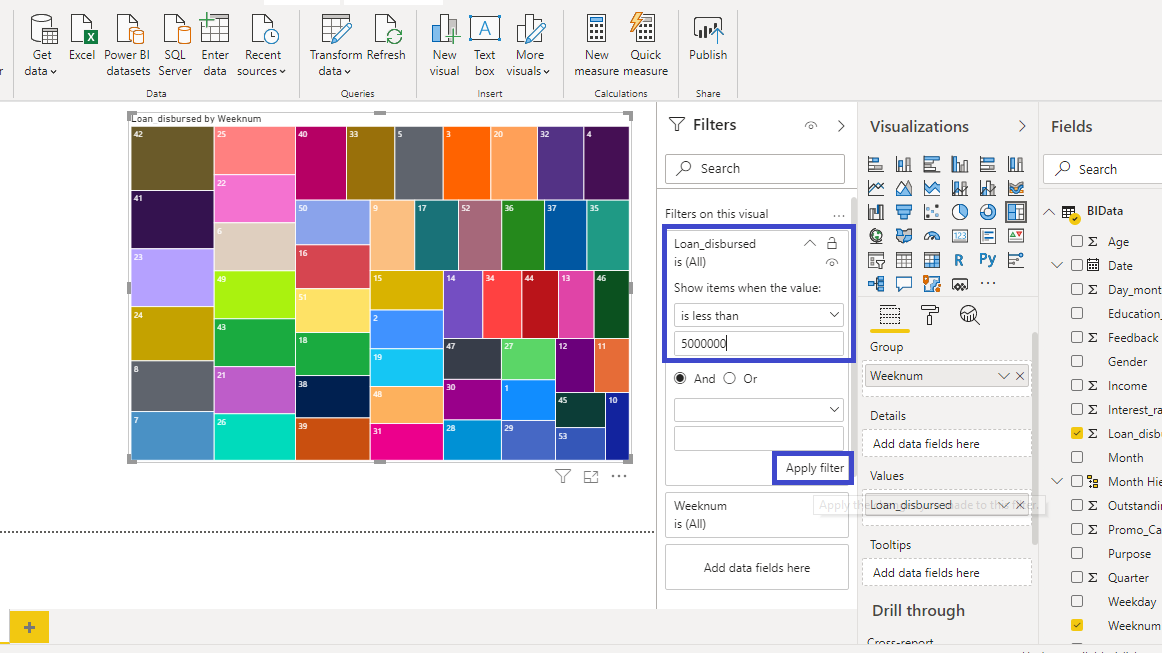
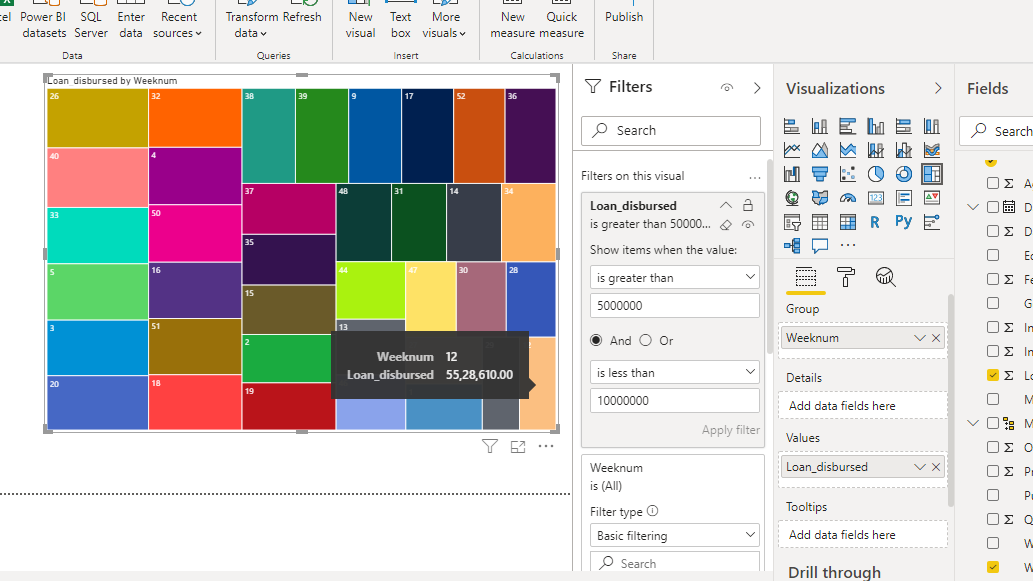
The filter operation to perform is to look at a week's numbers when the loan disbursed was less than $5 million. Type the value as shown below.
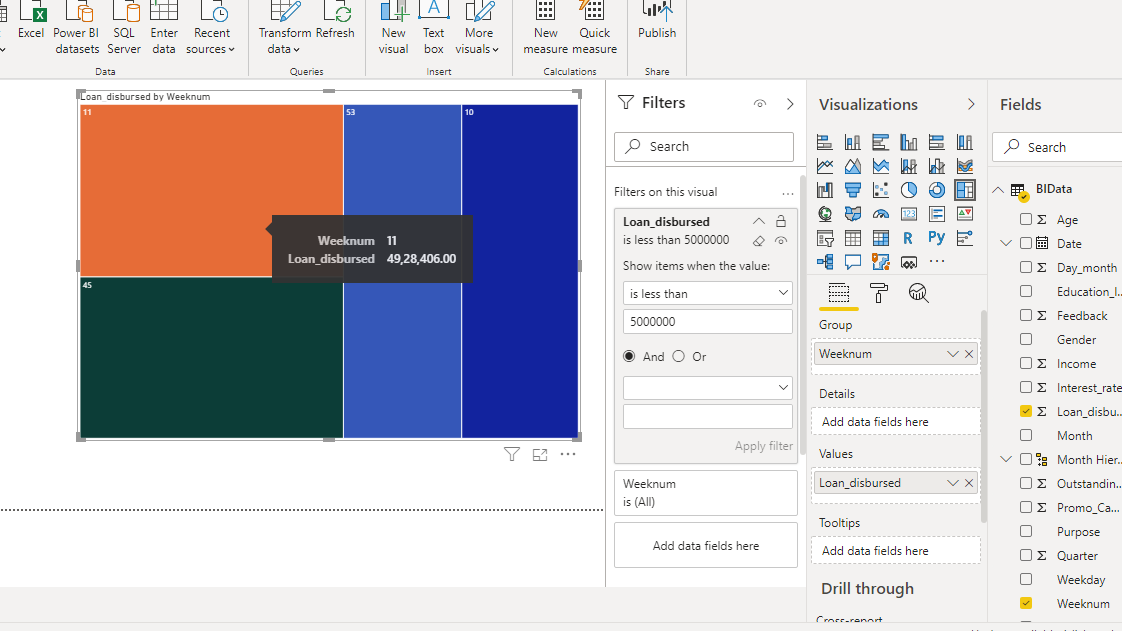
Click on Apply filter that gives the command to Power BI to perform this filter operation on the selected visual and display the resulting chart.
You can see from the output that there are five weeks of numbers that have less than $5 million loan disbursal.
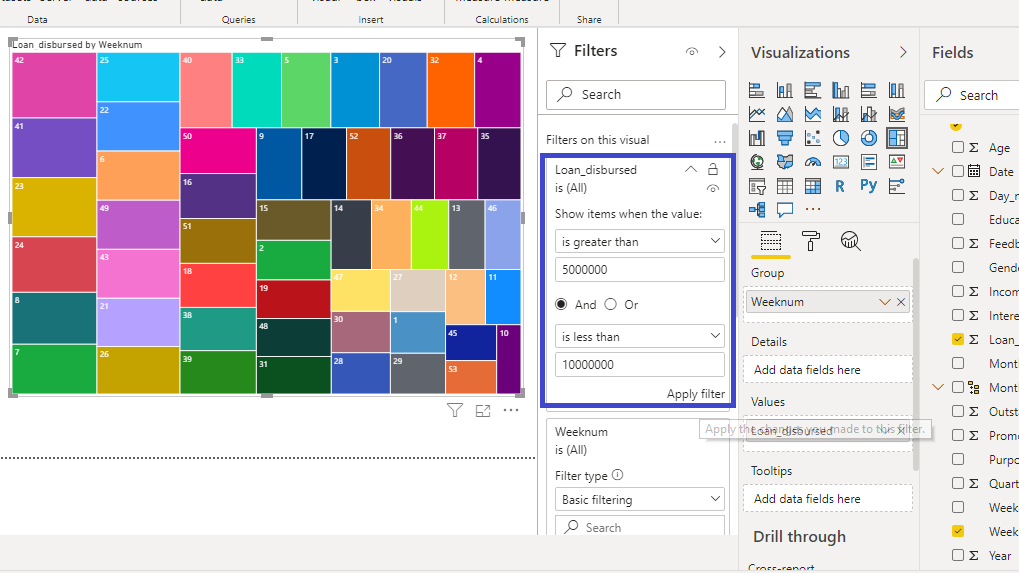
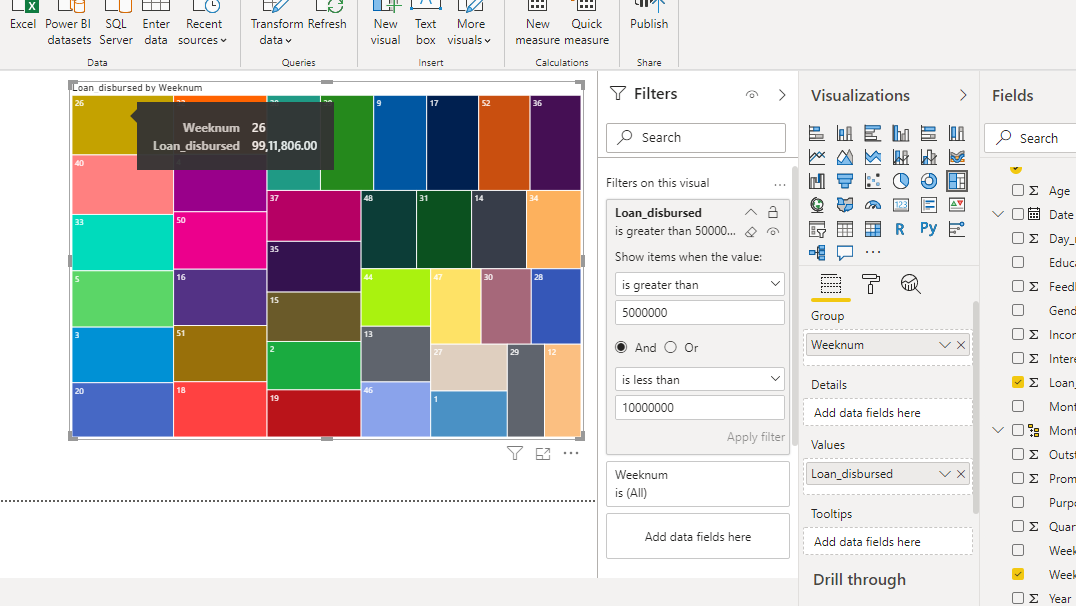
To extend the example above, if you want to find the week's numbers when the loan disbursal was between $5 million and $10 million, you can select the And option during filter.
This will create the desired output.
Filter on Categorical Variable
Categorical variables are defined as features in which mathematical operations can’t be performed. In the chart, Weeknum is the categorical feature because even though it is represented as numbers, you cannot add two weeks.
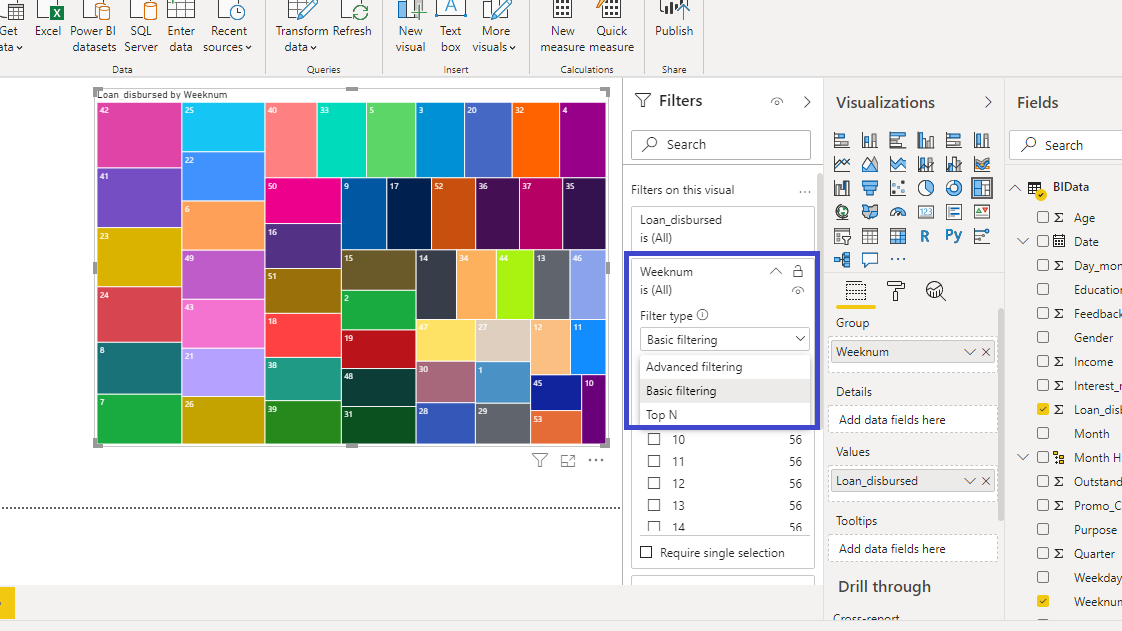
For Weeknum variable, there are several options available under Filter type. There are three types of filter operations: Basic filtering, Advanced filtering, and Top N.
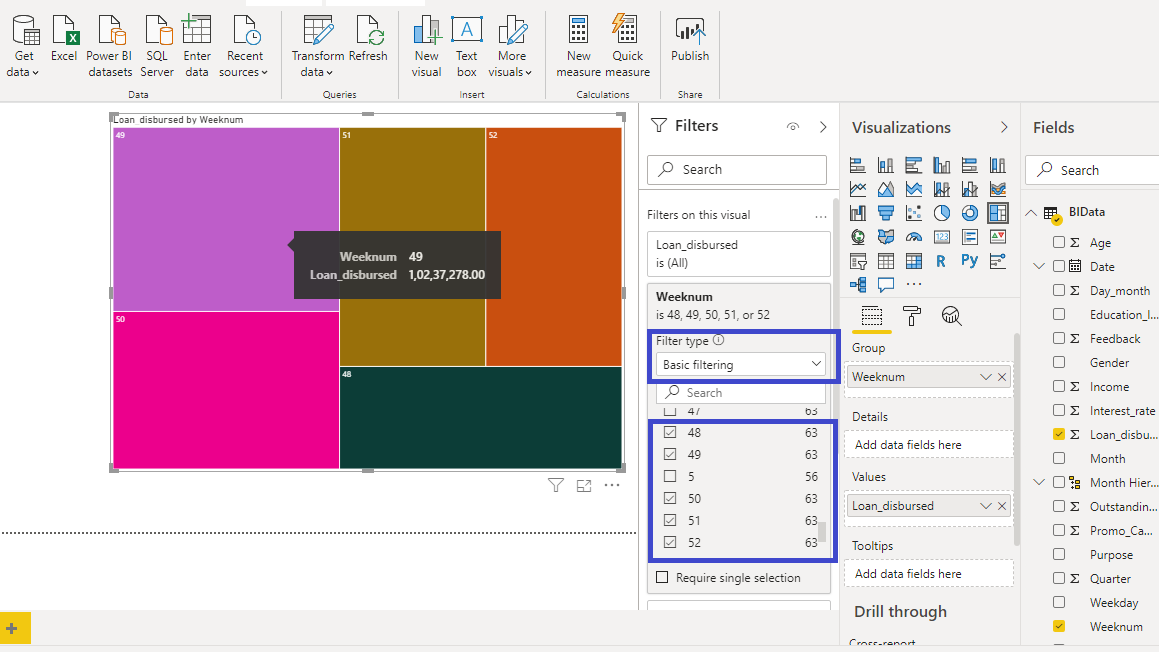
You will begin with Basic filtering. If you want to look at Loan_disbursed in the last few weeks of the year, especially closer to Christmas, you can select the corresponding weeks' numbers.
The other common filter operations performed on categorical features is to filter the categories of the variable against a measure. For example, if you want to use the top ten weeks in terms of Loan_disbursed, you can use the Top N filter.
Start by selecting Top N as Filter type. Under Show items, select Top and set the value to 10. Finally, drag the Loan_disbursed variable to the By value field.
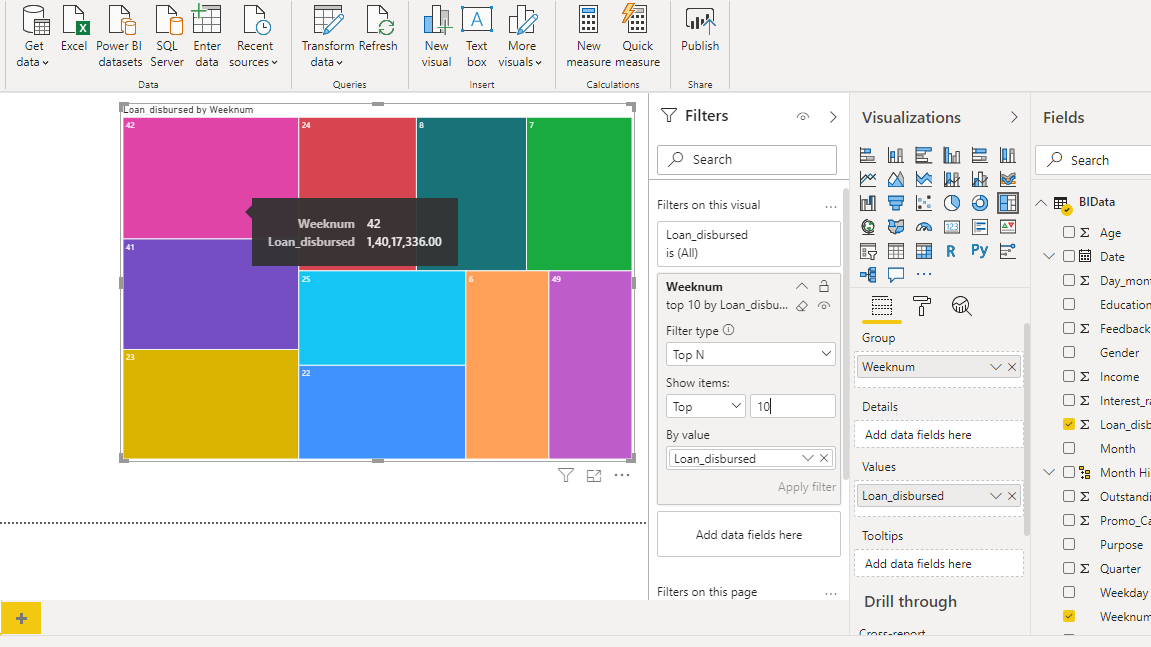
Click on Apply filter and the following output is displayed.
The above output shows that the week with the highest loan disbursal is week 42, followed by week 41 and so on.
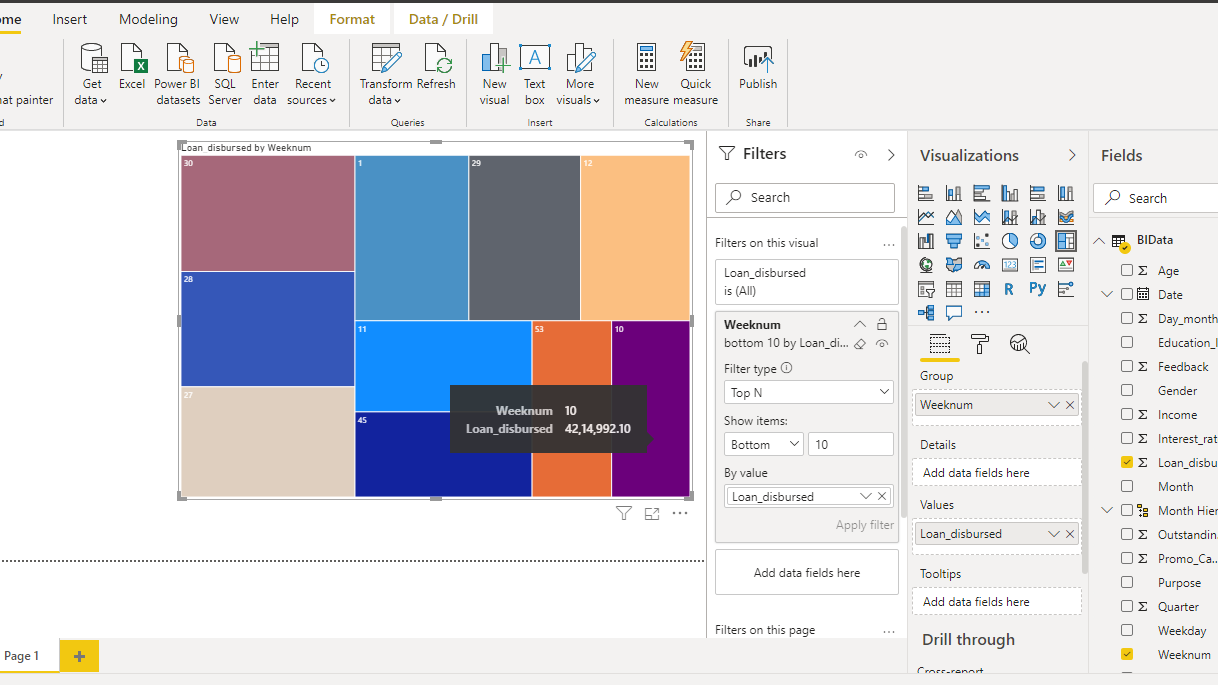
选择贷款发放额最低的最后十周很容易,只需对上述选择进行一次更改即可。在“显示项目”下,选择“底部”,然后单击“应用过滤器”。这将生成以下结果。
结论
探索性数据分析是机器学习和数据科学不可或缺的一部分。要从不同维度探索数据,需要执行多项过滤操作。这是一项常见任务,本质上与行业无关,这意味着它可以应用于银行和金融服务、制造业、公用事业、电子商务、零售等行业。这项技能将提高您的分析和商业智能能力。
要了解有关在 Power BI 桌面中构建强大可视化功能的更多信息,请参阅以下指南:
免责声明:本内容来源于第三方作者授权、网友推荐或互联网整理,旨在为广大用户提供学习与参考之用。所有文本和图片版权归原创网站或作者本人所有,其观点并不代表本站立场。如有任何版权侵犯或转载不当之情况,请与我们取得联系,我们将尽快进行相关处理与修改。感谢您的理解与支持!













请先 登录后发表评论 ~