
使用 Application Insights 捕获 Cosmos DB 指标
介绍
使用 Azure Cosmos DB 的一个更困难的方面是管理请求单元的消耗和配置。如果不能有效地使用请求单元,Cosmos DB 实例可能会受到严重限制,从而对用户体验产生负面影响。
在本指南中,您将了解如何使用 EventSource 捕获 Cosmos DB 请求的请求费用。然后,您将这些指标推送到 Application Insights,以便在应用程序上下文中进行分析。这对于确定应用程序中的哪个用户或功能产生了较高的请求费用非常有用。
要遵循本指南,您需要具有最新Azure CLI 的Azure 订阅。
设置 Azure 资源
要开始记录 Cosmos DB 指标,请创建:
- Azure Application Insights 组件
- Cosmos DB 数据库和容器
最简单的方法是使用 Azure CLI:
      $rg = 'rg-demo-ai-cosmos'
az group create -n $rg -l 'australiaeast'

az extension add -n 'application-insights'
az monitor app-insights component create --app ai-cosmos-demo --location 'australiaeast' --kind web -g $rg

az cosmosdb create --name cosmos-metrics-demo-pl --resource-group $rg
此代码片段使用 PowerShell 和 Azure CLI 创建 Application Insights 实例、Cosmos DB 数据库和 Application Insights 组件。
然后您需要创建一个.NET 应用程序来开始记录指标。
您还可以使用 CLI 来帮助您构建这个:
      mkdir cosmos-metric-demo
cd cosmos-metric-demo
dotnet new sln
dotnet new web
dotnet sln add .
dotnet add package Microsoft.Azure.Cosmos
dotnet add package Microsoft.ApplicationInsights.AspnetCore
创建事件监听器
.NET 具有一项名为事件源的功能,可以发布其他工具和库可以使用的低级事件。这些工具无法修改应用程序上下文中的数据,例如诊断源。可以收集的事件源数据的一些示例包括 SQL 请求、垃圾收集 (GC) 统计信息和内存分配。
Cosmos DB 实现了事件源,它发布请求和响应事件。您可以创建一个事件侦听器来侦听这些事件并将其写入 Application Insights。
下面的代码片段演示了如何做到这一点:
      public class DocumentClientEventListener : EventListener
{
    private bool _initialised;
    public static AsyncLocal<RequestTelemetry> Request { get; }
        = new AsyncLocal<RequestTelemetry>();

    protected override void OnEventSourceCreated(EventSource eventSource)
    {
        if (!_initialised && eventSource.Name == "DocumentDBClient")
        {
            this.EnableEvents(eventSource, EventLevel.Verbose, (EventKeywords)1);
            _initialised = true;
        }
    }

    protected override void OnEventWritten(EventWrittenEventArgs eventData)
    {
        if (eventData == null || eventData.Payload == null || eventData.EventSource?.Name != "DocumentDBClient")
        {
            return;
        }

        // const int cosmosDBRequestEventId = 1;
        const int cosmosDBResponseEventId = 2;
        if (eventData.EventId == cosmosDBResponseEventId)
        {
            OnCosmosDBResponseEvent(eventData, Request!.Value);
        }

        static void OnCosmosDBResponseEvent(EventWrittenEventArgs eventData, RequestTelemetry? requestTelemetry)
        {
            if (requestTelemetry == null)
            {
                return;
            }

            if (eventData?.Payload?.Count != 30)
            {
                return;
            }

            if (eventData.Payload[22] is string requestChargeAsString
                && double.TryParse(requestChargeAsString, out double requestCharge))
            {
                const string key = "CosmosDBTotalRequestCharge";
                var metrics = requestTelemetry.Metrics;
                if (metrics.ContainsKey(key))
                {
                    metrics[key] += requestCharge;
                }
                else
                {
                    metrics[key] = requestCharge;
                }
            }
        }
    }
}
此类订阅DocumentDBClient事件源。当它看到已发布响应事件时,它会提取请求费用并将其保存到 Application Insights 的请求遥测中。它使用AsyncLocal,这是一个特殊的类,允许您创建请求范围的变量。
您还需要创建一个中间件来设置请求遥测属性。
      // Startup.cs
app.Use((ctx, next) =>
{
    var requestTelemetry = ctx.Features.Get<RequestTelemetry>();
    if (requestTelemetry != null && DocumentClientEventListener.Request.Value == null)
    {
        DocumentClientEventListener.Request.Value = requestTelemetry;
    }

    return next();
});
此代码片段需要添加到Startup.cs的Configure方法的顶部。
最后,更新Program.cs以查看应用程序启动时的监听事件。
      private static DocumentClientEventListener DocumentClientEventListener;
public static void Main(string[] args)
{
    DocumentClientEventListener = new DocumentClientEventListener();
    CreateHostBuilder(args).Build().Run();
}
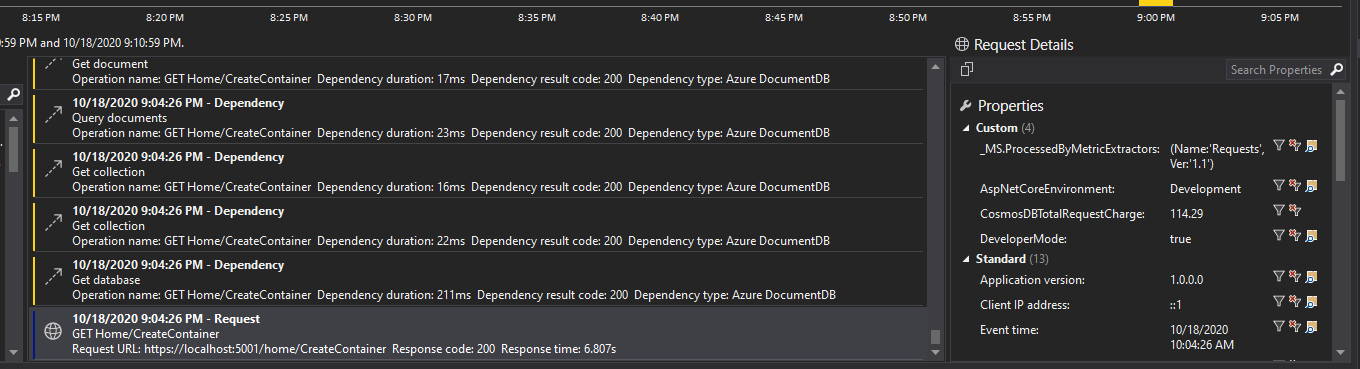
运行应用程序时,您应该会看到请求遥测数据,其中包含一个CosmosDBTotalRequestCharge指标,该指标汇总了该单个请求的所有费用。这可以具体告诉您哪些用户和路由存在 RU 使用问题。
注意:在撰写本文时,仅当您的CosmosClient配置为WithConnectionModeGateway()而不是直接 TCP 连接时,此技术才有效。
结论
监控和可观察性是使用分布式系统时需要掌握的重要技能。如果您了解 Event Source 等较低级别的 API,则可以轻松诊断性能问题。这在大型应用程序中尤其如此,因为您无法轻松查看所有代码。相反,您可以依靠指标来帮助您找出问题的根本原因。
免责声明:本内容来源于第三方作者授权、网友推荐或互联网整理,旨在为广大用户提供学习与参考之用。所有文本和图片版权归原创网站或作者本人所有,其观点并不代表本站立场。如有任何版权侵犯或转载不当之情况,请与我们取得联系,我们将尽快进行相关处理与修改。感谢您的理解与支持!


请先 登录后发表评论 ~